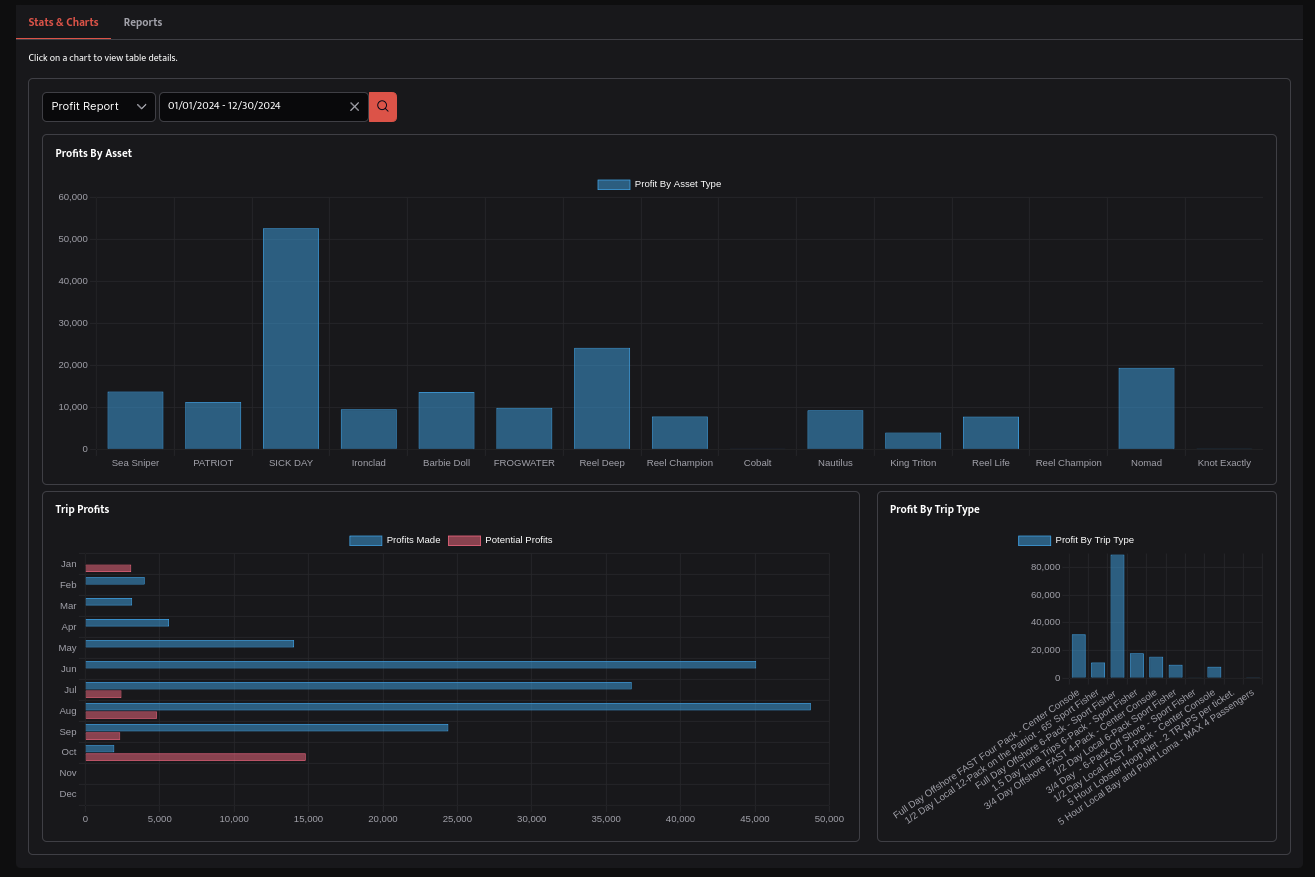
Know your numbers
- Revenue by asset, by trip type, by time period
- Participant counts and fill rates
- Payment collection rates
- Captain and boat payouts
- Groupon vs direct booking comparison
- Customer acquisition and retention metrics
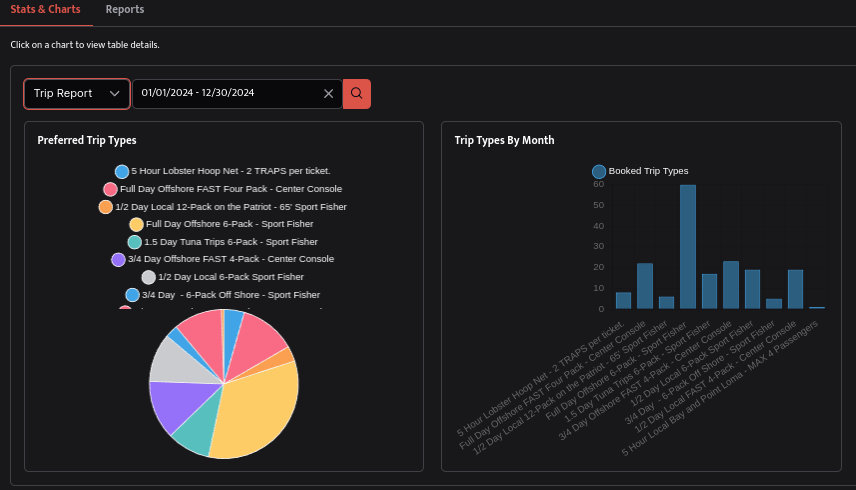
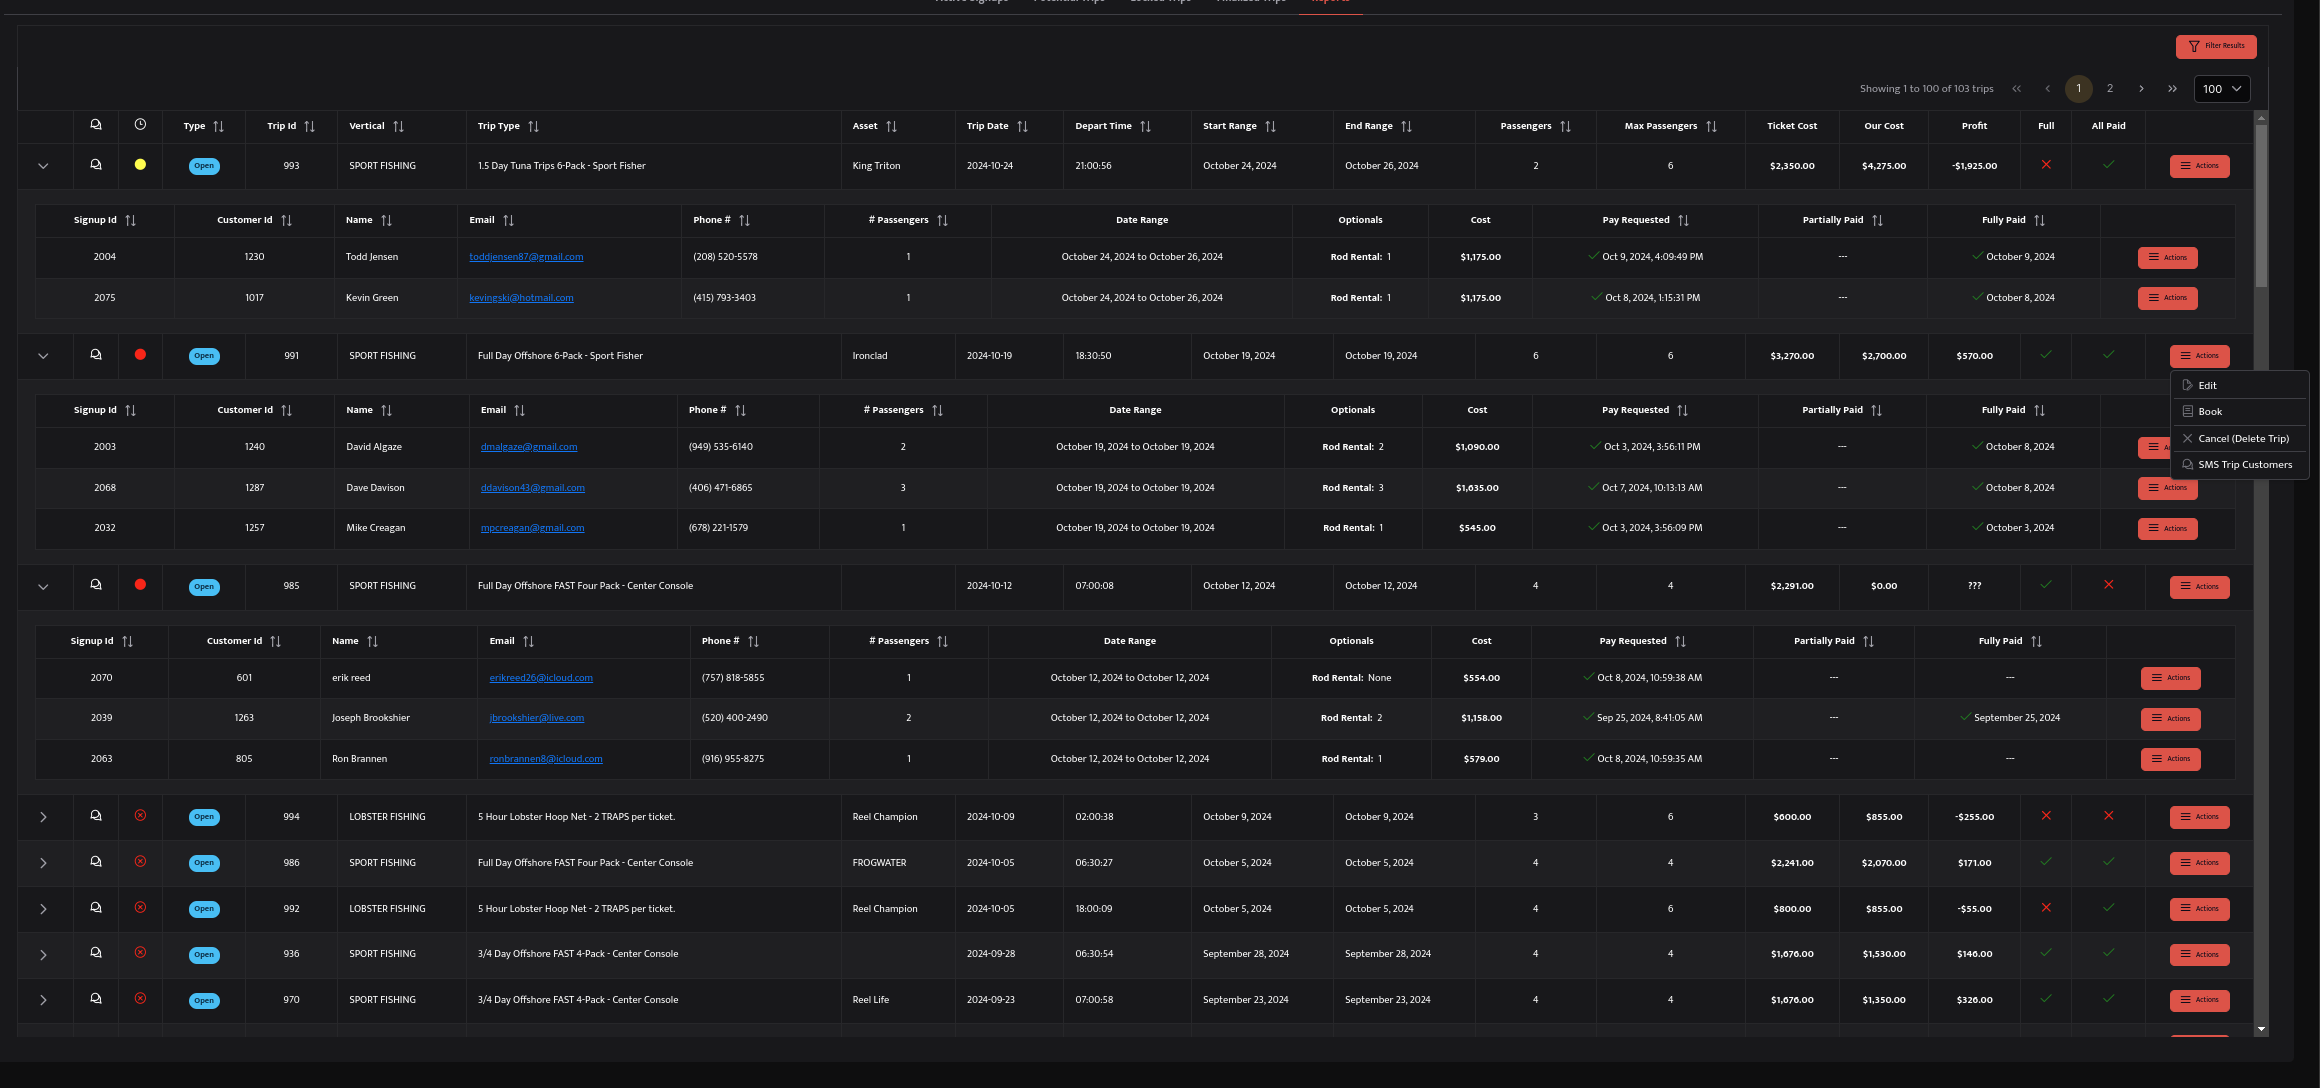
Revenue by boat, by trip type, by date range. Payout tracking. Reconciliation. Every dollar accounted for.
Get a Demo